Hot off the press! Results from our Coastal Landslide Observatory and PODCAST // by Catherine Pennington
Landslides experts at the British Geological Survey are excited to have finally published results from a project they have been working on for nearly twenty years. Cath Pennington tells us all about it…
 |
| The team at the Coastal Landslide Observatory nr Aldbrough, East Riding of Yorkshire. Left to right: Cath Pennington, Pete Hobbs, Matt Kirkham, Simon Holyoake, Nikhil Nedumpallile Vasu, Lee Jones. |
On a windswept, wave-battered cliff on the coastline of the East Riding of Yorkshire stands an unassuming landslide that has no idea just how important it is. This landslide is being watched. Every move it makes is being recorded and analysed by us here at the BGS.
This is our first Coastal Landslide Observatory, where we have been collecting data for the last 18 years. This long term monitoring has allowed us to capture and record how the ground behaves through cycles of deep-seated landslide activity.
Today, this work has been published in two papers in the Quarterly Journal of Engineering Geology and Hydrogeology:
Why do we need a Coastal Landslide Observatory?
We know much of England’s southern and eastern coastline is eroding. In some places, this is happening more quickly than in others. In fact, the Landslide Observatory is part of the 50 km-long Holderness coast, which is one of the most rapidly eroding coastlines in Europe. Add sea level rise and climate change predictions of bigger and more frequent storms into the mix and it is clear that we need to be prepared so we can be resilient.
 |
| The BGS Coastal Landslide Observatory near Aldbrough, East Riding of Yorkshire |
We need to understand how the coast behaves so we can forecast what is likely to happen in the future and the rapid rate of erosion at our Aldbrough CLO provides a good opportunity for studying landslide processes. For example, in order to develop and position early warning systems we need to understand how far inland there is a measurable response of the ground to the coastal landsliding. Communities affected, policy makers, local government and national agencies need to know how to manage coastal change as we cannot, and indeed should not, protect the entire coastline with hard engineered defences.
 |
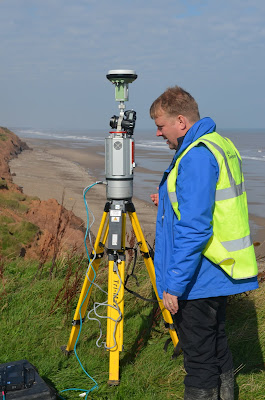
| Matt Kirkham, Geotechnical Soils Lab Specialist, carrying out a Terrestrial LiDAR survey at the Coastal Landslide Observatory, Aldbrough, East Riding of Yorkshire |
People have been measuring the rate of coastal retreat for decades in the UK, longer even. This started with highlighting changes in the cliff top on Ordnance Survey maps, aerial photograph comparisons and directly measuring changes with a tape measure. These methods produce an estimate of general coastal retreat but this can only ever be linear e.g. 1.5 metres per year. We do not know if the 1.5 metres happened little by little or suddenly all at once.
Peter Hobbs, project manager for the CLO, explains: “What we want to understand is much more than just the general speed at which the cliff top is retreating. We want to know how the landslide behaves and what drives it”. So how have we done this?
The Observatory
As well as geological and geotechnical tests and observations, we have used several techniques to monitor the landslide:
Firstly, observational techniques include terrestrial LiDAR and UAV (drone) photogrammetry. Terrestrial LiDAR (pictured right and below) is a laser scanner which, when combined with highly accurate GPS, allows us to produce 3D models of the cliffs. Lee Jones, project leader for geomatics explains: “Using several scans made at different times, we can calculate the amount of material lost from the cliffs (volume loss) and measure cliff top retreat. We can also see how the landslide is changing and where”.
 |
| Lee Jones using the back-pack mounted Pegasus LiDAR |
We were one of the first earth-science users of terrestrial LiDAR techniques in Britain and, over the duration of the monitoring period at the CLO, we have developed the technology and interpretation of data considerably.
The UAV enabled us to capture aerial photographs and fill in gaps and shadows where the ground-based LiDAR cannot access.
 |
| 2001-2017 LiDAR scans showing the cliff retreating. Only scans from alternate years are used here to simplify the image |
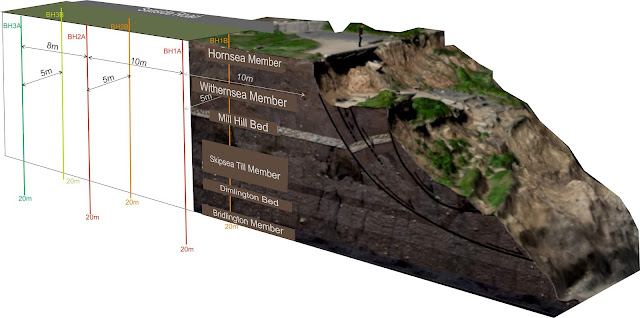
Secondly, geotechnical monitoring. Three pairs of boreholes were drilled 20 m into the ground. These were set 10 m, 20 m and 28 m back from the cliff edge. Piezometers and inclinometers were installed to measure changes continuously in pore water pressure and any physical movement of the boreholes. The idea is to observe any changes as, with time, the cliff effectively approaches the boreholes.
 |
| The Aldbrough Coastal Landslide Observatory showing the instrumented borehole pairs, sited landward of the cliffs |
Lastly, geophysical instrumentation was added. This is PRIME (Proactive Infrastructure Monitoring and Evaluation) which is BGS’s automated electrical resistivity topography system. This measures changes and movements in water content and temperature and is live-streamed back to the office via the web.
We have also installed a weather station and get wave and storm data from a wave buoy just offshore.
Results
"We have measured the amount of cliff lost to the sea. This ranges from 1200 to 6300 m3 per 100 m section of cliff per year. That’s roughly 0.5 - 2.5 Olympic-sized swimming pools for every 100 m length of cliff, every year."
Using this range of monitoring techniques, we have been able to track changes in the cliff slope more accurately than previously possible. Preliminary results are:
- We have measured and observed the primary landslide type as deep-seated rotational with secondary topples, rock fall and flows.
- We have found that landslide activity is cyclic, with major landslide events occurring every six to seven years. This activity is unsurprisingly related to storm frequency and wave energy but it is mostly driven by groundwater.
- The Dimlington Bed is key for rotational landsliding. It is a soft silty clay that the overlying geology slides along.
- We have measured the amount of cliff lost to the sea. This ranges from 1200 to 6300 m3 per 100 m section of cliff per year. That’s roughly 0.5 - 2.5 Olympic-sized swimming pools for every 100 m length of cliff, every year.
 |
| Peter Hobbs, happy with the recent upgrade to the weather station |
And the future…
Back to Peter Hobbs: “Long term monitoring is a huge commitment from everyone involved, without which this kind of science research would not be possible. The only way to do this accurately is to commit to long term monitoring. We intend to continue our work at our current CLO and are considering other sites and other new technologies”.
We hope that this work will contribute not only to our understanding of landslide processes, but will also inform policies such as Shoreline Management Plans to help manage the coastal changes we will see in the future.
You can read more about this and our other landslide observatories here. Keep up-to-date with new developments on the BGS Landslides Team on Twitter. The team can be contacted here.

Comments